
Python has become as the programming language of choice in the data science space, which is no surprise. When it relates to data science work, there is no other language that provides easy syntax, readable, and a rich ecosystem of libraries that address everything from simple manipulation of data to running complex machine learning or deep learning tasks.
At the forefront of Python’s capabilities in data science are specialized libraries that are designed for specific tasks. Libraries range from data wrangling to statistical analysis, visualizations, modeling, and deploying your models. Essentially, you can clean a messy dataset, build a predictive model, visualize trends, or develop rudimentary neural networks much quicker with the extensive use of libraries in Python.
Among the most powerful and essential libraries are:
- NumPy – For performing numerical computations and matrix operations.
- Pandas – For structured representations of data to manipulate and analyze.
- Matplotlib & Seaborn – For static, animated intent and visualizations.
- Scikit-learn – For traditional machine learning algorithms.
- TensorFlow & PyTorch – For building deep learning or neural network models.
- Statsmodels & SciPy – For statistical modeling and scientific computation.
In this guide, we will explore each individual library and how each plays a key role in the data science workflow, allowing you to develop better and smarter data solutions sooner.
NumPy

Overview:
NumPy (Numerical Python) is one of the key libraries in the Python data science ecosystem. NumPy is a powerful tool for working with large multidimensional arrays and matrices and has a whole host of mathematical functions to operate on these objects.
Key Features:
- Ndarray (N-dimensional array): NumPy’s core data structure is an ndarray to enable fast and efficient storage and manipulation of numerical data.
- Mathematical functions: Built-in capabilities to perform operations ranging from linear algebra to statistics to trigonometry, etc.
- Broadcasting: Perform array operations between arrays of different shapes without the need to copy or reshape data explicitly.
- C/C++/Fortran interoperability: Utilize libraries implemented in low-level languages for performance-sensitive tasks, while using NumPy for interfacing with your Python scripts.
- Random Number Capabilities: Tools to generate random data for simulations, modeling with probabilities, etc.
Common Uses:
- Data Analysis: Perform complex numeric operations when manipulating data and exploring.
- Machine Learning: Specifically designed to support matrix operations that are offloading algorithm computations and manipulating tensors.
- Scientific Computing: Widely used in engineering, physics, and for generating statistical modeling simulations.
- Image Processing: Images can be represented as direct arrays for filtering and other transformations. Some operations can be applied at the pixel-level directly
Pandas

Summary:
Pandas is a significant and powerful open-source Python library for data analysis and manipulation. It has two major data structures: Series (1D) and DataFrame (2D), that informed intelligent and efficient data representation and manipulation. Pandas makes the process of data preparation more manageable whether working with CSV, SQL, or Excel files.
Features/Capabilities:
- Series and DataFrame – all the different data structures ultimately provide a means to present and manipulate 2D (tabular) and 1D (single columns) data.
- Missing Data – Many built-in functions used to identify, fill, or eliminate missing data with a single function call.
- Merge/Join – allows for merging of multiple data sources in a SQL type join or merge.
- Groupby operations – allows for aggregation or transformation of related grouped data using mean(), sum(), count(), and so on.
- Time-series – index by timestamp, resample the time intervals, convert between time frequencies.
- Input/output – can read and write from a variety of source – csv, excel, json, SQL.
Common Use Cases:
- Data Cleaning – prior to data analysis, raw data must typically be cleaned in order to address duplicates, null values, or type conversions
- Exploratory Data Analysis (EDA) – summarizing, filtering, and visualizing data to identify trends and insights
- Analyzing Financial Data – such as stock prices, stock returns, or economic indicators that are generally organized as time-series.
- Machine Learning Workflows – Prepare and structure datasets for input into models for prediction
Matplotlib

Overview:
Matplotlib is a full-featured library for Python that supports static, animated, and interactive visualizations. It is the basis for numerous other plotting libraries in Python and works quite well for creating complex plots with ease and customization. Matplotlib integrates readily with NumPy arrays and Pandas DataFrames, making it a great library to visualize data across virtually all data formats.
Key Features:
- Highly customizable – All elements of the plot can be adjusted, for instance, line styles, colors, legends, axes, ticks, annotations, etc.
- Different plot types – Can produce line plots, bar charts, histograms, scatter plots, pie charts, etc.
- Interactive – For example, it supports interactive environments to produce plots such as Jupyter Notebook, where you could modify the data in real-time.
- Library support – Because it works well with Pandas, NumPy, and SciPy, you have a streamlined application-to-data-to-visualization pipeline.
- Export options – Can easily export your plots in a variety of file formats for visualization sharing, such as PNG, PDF, SVG, and EPS for publication.
Typical Uses:
- Data visualization: Building tidy, coherent charts to display insights from your data.
- Exploratory data analysis: Quickly detecting trends and anomalies in your data.
- Scientific/academic research: Producing high-quality, publication-ready plots for journals and papers.
- Business reporting and dashboards: Visualization for displaying business metrics that can assist in forecasting trends and making decisions.
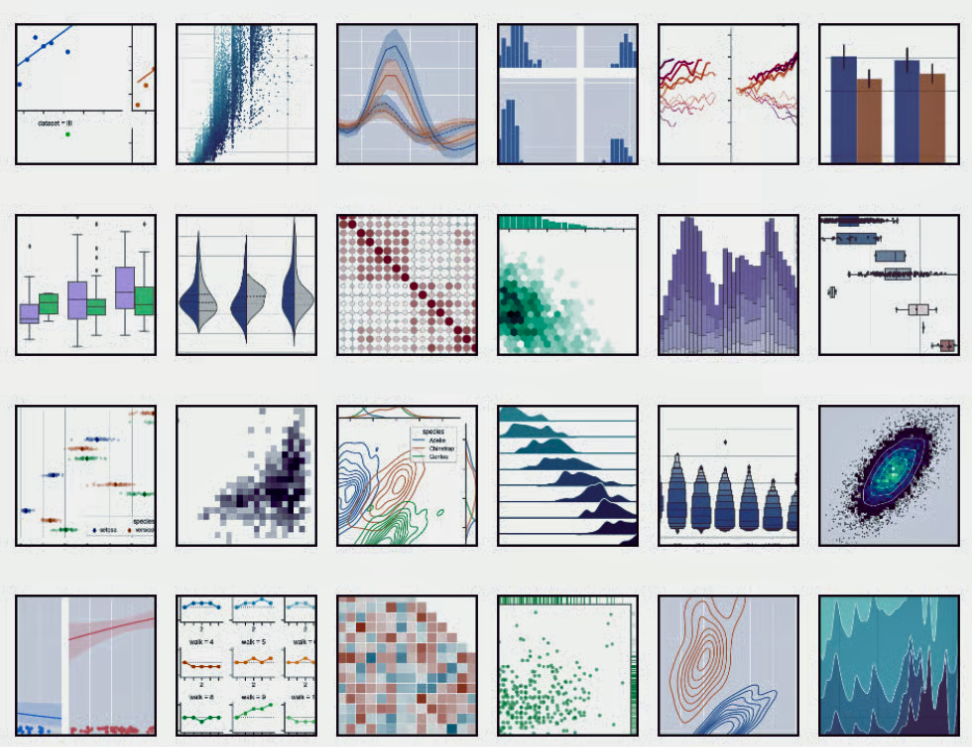
Seaborn
Overview:
Seaborn is a high-level data visualization library for Python, built on Matplotlib. It provides an easier way to create nice and informative visualizations to explore and understand the data with charts, focusing on relationships, distributions, and comparisons.
Key Features:
- Statistical Visualizations: Easily create plots showing statistical relationships (regression lines, distributions, correlations).
- Built-In Themes: Seaborn comes with default styles and color palettes that look great on reports and presentations.
- Designed for Pandas: Seaborn is designed to use Pandas DataFrames, making it easy to plot data in a structured format.
- Categorical Support: Seaborn provides specific plots to analyze and visualize categorical data (i.e., box plots, violin plots, and strip plots).
- An Aesthetic Palate: Seaborn has example color palettes that look great and enhance clarity and readability.
Typical Uses:
- Exploratory Data Analysis (EDA): Charting to provide visualizations of trends, relationships, and distributions in datasets.
- Statistical Insights: Highlight patterns from datasets with a visualization of regression trends or variables distributions.
- Business Reporting: Reporting with clean, easy-to-read graphics from data-driven insights.
- Scientific Research: Using polished, publication-ready charts to help with academic and technical usage.
Scikit-learn
Scikit-learn is an open source library in Python that provides powerful capabilities for implementing machine learning and data analytics. Scikit-learn is built on top of popular libraries such as NumPy, SciPy, and Matplotlib, and is easily used to apply different ML algorithms with a simple and highly consistent interface, which is extremely valuable for both novices and professionals.
Key Features:
- All-in-one Algorithm Support: Offers numerous models for classification, regression, clustering, dimensionality reduction, and ensemble methods.
- Preprocessing Functions: Built-in functions for steps such as scaling, normalization, encoding categorical variables, and transforming features.
- Evaluation Metrics: Cross validation, grid search and evaluation metrics for accuracy, precision, recall and f1 score.
- Pipeline: Provides a way to chain preprocessing and modeling steps together into a Pipelines, which helps with clean workflows and reproducibility.
- Data Compatibility: Can be used with NumPy arrays, Pandas Dataframes, or SciPy sparse matrices.
Typical Uses:-
- Machine Learning Modeling: Implementing classification (e.g. decision trees, logistic regression), regression (e.g. linear regression), and clustering (e.g. K-means) models.
- Data Preprocessing: Imputation, encoding and scaling data prior to entering into a model.
- Model selection and evaluation: Model comparisons and selecting the best model using validation techniques and model performance metrics.
- Dimensionality Reduction: Reducing the feature space with techniques such as PCA for data visualization and model performance improvement.
- Recommendation Engines: Collaborative and content-based recommendation systems using similarity-based algorithms.
TensorFlow
TensorFlow, created by Google, is a ground-breaking open-source software for developing and deploying machine learning and deep learning models. TensorFlow offers researching and production capabilities while being able to provide tools that scale and support flexible application interfaces to allow for ease of creating, training, and deploying; all in a variety of platforms and devices.
Key Features:
- Deep Learning Capabilities: TensorFlow can take on the construction of complex models like neural networks, CNNs(Convolutional Neural Networks), and RNNs (Recurrent Neural Networks).
- Flexible and Scalable Architecture: TensorFlow can scale and support computation on CPUs, GPUs, and TPUs; Seamlessly adjusting the scale as you move from local to cloud application or anything in between.
- Cross-Platform Compatibility: You can easily deploy models to desktops, mobile devices, web browsers, and Apple’s cloud offering.
- High-Level APIs with Keras: Keras provides a simple approach to model building with a well-designed user-friendly API.
Ecosystem:
- TensorFlow has a rich ecosystem of tools, such as:
- TensorFlow Lite – easy deployment methods onto mobile or edge devices.
- js – run your models in the browser.
- TensorFlow Extended (TFX) – an advanced state of flowing through a productionized machine learning workflow.
Common Applications:
- Image Classification: Used in object detection, facial recognition, and image tagging in computer vision tasks.
- Natural Language Processing (NLP): Powers models for text classification, machine translation, sentiment analysis, and more.
- Speech Recognition: Supports voice to text applications, virtual assistants, and transcription tools.
- Reinforcement Learning: Used in robotics applications, simulated self-driving vehicles, and game Ai.
- Healthcare: Enhances diagnosis in medicine and similar imaging tasks so it can analyze x-ray, MRI, and predicting health outcomes.
PyTorch
PyTorch is an open-source deep learning framework developed by the Facebook AI Research (FAIR) group. It is recognized for its flexibility, ease of use, and dynamic computational graph, making it popular among both researchers and developers. PyTorch is particularly useful for rapid prototyping and deploying deep learning models into production.
Key Features:
- Dynamic Computational Graphs: Allows you to build computation graphs as you go, allowing you to change the graph immediately, which is perfect for experimenting and researching.
- GPU Acceleration: Supports GPU computation natively, enabling fast training of large neural networks.
- Flexible in Models You Can Build: Easily build various types of models like CNNs, RNNs, and transformers.
- Autograd: Automatically computes gradients during backpropagation when training the model.
- Good Integration with Python: Works well with ‘core’ scientific computing libraries like NumPy, SciPy and Pandas.
Typical Uses:
- Deep Learning Applications: Developing state of the art models for computer vision, natural language processing, and speech recognition.
- AI Development & Research: Trusted by universities and AI researchers due to its readable syntax and extensible architecture.
- Reinforcement Learning: Used in such areas as robotics, game development, and any simulated task that requires decision making.
- Natural Language Processing (NLP): Used for applications such as chatbots, text classification, translation, and text generation.

Statsmodels
Statsmodels is a Python library designed for statistical modeling, inference, and hypothesis testing. It enables users to build, analyze, and interpret statistical models and provides user access to detailed summaries and diagnostics. In academia and research contexts, Statsmodels is especially useful for its typical rigor and outputs.
Noteworthy Features:
- Robust Statistical Models: The library has built-in support for linear regression, generalized linear models (GLMs), logistic regression, and several advanced statistical models.
- Hypothesis Testing: Statsmodels provides a full suite of tests for making inferences statistically, including t-tests, ANOVA, chi-square, and more.
- Exploratory Data Analysis: Statsmodels offers a suite of tools to compute descriptive statistics, correlation matrices, and visual exploration of data.
- Model Diagnostics: The library has built-in functionality to conduct residual analysis, measure goodness-of-fit, and evaluate model performance.
- Time-Series features: Statsmodels has built-in support for auto-regressive models, ARIMA, seasonal decomposition, and forecasting.
Typical Use Cases:
- Econometrics: Where researchers model and analyze economic data to describe trends and make predictions.
- Time-series analysis: Where researchers develop and assess models to forecast financial data, environmental data, and data from scientific research.
- Statistical Inference: Where researchers wish to estimate model parameter values and compute hypothesis tests based on data sampled from the population.
- Social Science Research: The library is frequently used to conduct survey analysis, behavioral research (predominately psychology), and experiment data in several other fields, including sociology and educational research.
SciPy
SciPy is an open-source Python library that provides a broad range of capabilities for scientific and technical computing. SciPy builds upon NumPy, giving it additional knowledge and capabilities including additional advanced mathematical, statistical, and optimization capabilities. SciPy is widely used in engineering, physics, data science, and other computationally intensive applications, allowing users to address complex mathematical problems in a comfortable and efficient manner.
Key Features:
- Scientific Computing.Household Tools: Includes advanced functionality to solve problems related to optimization, integration, interpolation, finding roots, and signal processing.
- Sparse Matrices: Efficiently represents large, sparse data without using a lot of memory.
- Linear Algebra: Includes solvers for linear systems, eigenvalue problems, and matrix factorizations.
- Special Math Functions: These functions include several useful functions like Bessel, gamma, and error functions used often in scientific computation.
- Signal Processing Algorithms: Fourier transforms, filtering, spectral analysis, etc.
Typical Use Cases:
- Optimization of Problems: Problems associated with solving mathematical functions with respect to the minimization (or maximization) of parameters or to find optimal configurations.
- Signal Processing: Models and algorithms to analyze and filter signals in audio, communications, and image processing domains.
- Integration: Models and algorithms for handling complex integrals found in scientific modeling problems, physics simulation problems, or engineering design problems.
- Machine Learning: Give data scientists support for clustering, dimensionality reduction, etc., as well as optimization.
- Statistics: Models to conduct statistical tests, hypothesis testing, and probability tests.
Final Conclusion of the blog,
Python has been able to dominate the data science space, primarily due to a platform of libraries which have been developed to serve particular purposes (e.g., data manipulation, statistical analysis, machine learning, deep learning, and data visualization).
NumPy and Pandas create the underlying functions that allows data professionals to work with, and efficiently analyze, data. MatplotLib and Seaborn display raw numbers as visualization, while Scikit-learn, TensorFlow, and PyTorch allow users to build and train predictive models. Specialized libraries, such as Statsmodels and SciPy, extend a data scientist’s experience into advanced statistical analysis and scientific computing.
With all of these libraries, professionals are equipped with all they need to extract knowledge, build intelligent systems, and resolve real-world problems. Whether you are a beginner exploring data science fundamentals, or a practicing data scientist looking to provide solution with emergent technology, familiarity with these libraries will be very effective in maximizing your utility when working with data.
Python is not simply a programming language, it is the engine of data science in the modern era!