Overview of Power BI
Power BI is a comprehensive business intelligence ecosystems, not just a tool for data visualization. Data Analysis Expressions, or DAX, is the engine that drives its analytical capabilities. Gaining proficiency with the Power BI DAX function library is essential if you want to advance your Power BI abilities. From simple formulas to complex computations, this blog will guide you through every facet of utilizing DAX functions in Power BI. It will incorporate key terms such as DAX formulas Power BI, DAX studio Power BI, and more.
What is DAX in Power BI?
DAX (Data Analysis Expressions) is the formula and expression language used in Power BI, Excel Power Pivot, and SSAS (SQL Server Analysis Services). It enables users to build sophisticated calculations, custom measures, and dynamic filters within their reports.
Whether you’re calculating Year-to-Date (YTD) sales, creating customer segments, or filtering datasets based on conditions, DAX function Power BI allows you to analyze your data effectively.
- Measures (dynamic calculations like Total Sales, Profit Margin, etc.)
- Calculated Columns (row-by-row computed values)
- Calculated Tables (virtual tables created from expressions)
- Advanced filters and time intelligence (e.g., Year-to-Date, Previous Month)
Example of a DAX Formula:
Total Sales = SUM(Sales[SalesAmount])
Key Applications of DAX in Power BI:
- Create dynamic KPIs that react to slicers and filters;
- Execute complex computations beyond default aggregations
- Provide real time intelligence (YoY, MTD, QTD, etc.) available.
- Manage custom filters and conditional logic.
Consider DAX as an enhanced version of Excel formulas designed for interactive dashboards and large-scale data models.
Why Learn Power BI DAX Functions?
Recognizing the true capabilities of Power BI dashboards can be achieved by learning Power BI DAX formulas. Here are the reasons why this is important:
- Dynamic Key Performance Indicators: Create indicators that will change based on a filter selection.
- Complex Filtering: Control the data context more than ever before.
- Time Intelligence: Manage date granularity from days, months, years.
- Data Transformation: Conduct calculations at the row and/or table level.
The true strength of Power BI is the ability to think through data, and DAX is the brain behind the thought process.
Key Concepts of DAX Function in Power BI
Before we start looking at the formulas, we can first talk about a few important concepts:
- Row Context
This is when a formula runs in a row-by-row basis, typically when working primarily with calculated columns.
- Filter Context
The filtering that is done with visuals, slicers, or measures; filter context is crucial to writing valid DAX expressions.
- Context Transition
This occurs when row context is changed to filter context, this normally occurs through authors using a function like `CALCULATE()`.

Getting Started with DAX Formulas Power BI
The syntax of DAX is simple but powerful. DAX formulas typically consist of:
- Function Name
- Column/Table References
- Expressions
For Example:
Total Sales = SUM(Sales[SalesAmount])
This formula uses the SUM function to calculate the total sales amount.
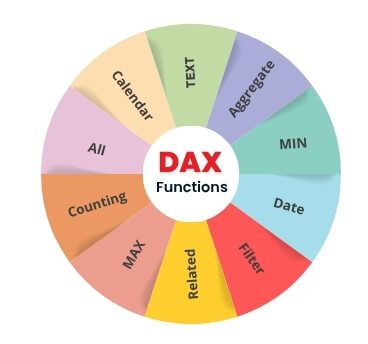
Categories of DAX Functions in Power BI
1. Aggregation Functions
In Power BI, aggregation functions are used to take a set of values and perform a mathematical operation on them to return a single summary result. Aggregation functions are important when you want to summarize a lot of data, and/or total values, averages, counts, or max/min values.
Common Aggregation functions include:
- SUM()
- AVERAGE()
- MAX()
- MIN()
- COUNT()
For Example:
Total Profit = SUM(Sales[Profit])
2. Logical Functions
Logical functions in Power BI enable decision-making processes in DAX formulas or expressions. They evaluate logical conditions and return results based on whether those conditions are true or false. Logical functions can be used when making calculated columns or measures that depend on conditional logic.
Common Logical Functions Include:
- IF()
- SWITCH()
- AND()
- OR()
For Example:
High Value Customer = IF(Sales[SalesAmount] > 10000, “Yes”, “No”)
3. Filter Functions
Filter functions in Power BI represent a unique way to manage filter context against the data when calculating summaries. They allow one to set aside, unacknowledge, or redefine filters on defined tables or columns — or allow truly powerful dynamic expressions. Filter functions have distinctive utility in using CALCULATE() or Native Logic in DAX functions.
Common Filter Functions Include:-
- CALCULATE()
- FILTER()
- ALL()
- REMOVEFILTERS()
For Example:
Regional Sales = CALCULATE(SUM(Sales[SalesAmount]), Sales[Region] = “North”)
4. Time Intelligence Functions
Time intelligence functions in Power BI provide management and comparison of data based on time periods. The Time intelligence functions in Power BI can track metrics across different time periods; days, months, quarters, and years. These functions are particularly useful in business scenarios when looking at sales growth trends, creating financial reports, or conducting year-over-year comparisons.
Common Time Intelligence Functions Include:
- TOTALYTD()
- DATESMTD()
- SAMEPERIODLASTYEAR()
- PARALLELPERIOD()
For Example:
Sales YTD = TOTALYTD(SUM(Sales[SalesAmount]), ‘Date'[Date])
5. Text Functions
Text functions are used in Power BI to process and format characters. The text functions are able to combine them, extract them, or format strings in function specific ways. Text functions are typically used in data cleaning, generating custom labels for categories and formatted outputs for better interpretation.
Common Text Functions Include:
- CONCATENATE()
- LEFT()
- RIGHT()
- UPPER()
- LOWER()
6. Information Functions
Information functions in Power BI are functions that return information about the data type or state of a value. These functions can be used to check for errors, handle blank values, and validate numeric types. They are often helpful in error handling logic, and in ensuring data quality during more complex calculation scenarios.
Common Information Functions Include:
- ISBLANK()
- ISNUMBER()
- IFERROR()
7. Mathematical Functions
Power BI uses mathematical functions to make various numeric operations which can include simple rounding (ROUND function), modulus operations (MOD function), and abstract operations (ABS function). Mathematical functions are intended to provide simple arithmetic transformations, manipulate decimal places, and format data for KPI’s and financial calculations.
Some common Mathematical Functions consist of:
- ROUND()
- CEILING()
- MOD()
- ABS()
These are just a few examples of the powerful library of DAX function in Power BI.
Analytics Training Hub is an accredited partner to help and support learners to prepare for, and then take, the official Microsoft Power BI Certification Exam (PL-300).
What does this mean?
- High-quality training delivered by qualified tutors whose training aligns with Microsoft’s official courseware
- Practical experience using real-world data scenarios
- Full support around registration and scheduling of the PL-300: Microsoft Power BI Data Analyst exam
- Multiple mock tests, revision sessions and exam readiness practices
- Digital certification issued by Microsoft when you successfully pass the exam
Who can apply?
Anyone who has completed our Power BI training and wants to gain a recognised, global certification to enhance their resume and career.
Why get certified?
- Recoginsed globally by employers
- Improved employment opportunities and credibility
- Increase the appeal of your LinkedIn & professional profile
Master Power BI From Scratch
No experience required—learn to work with data via Power BI.
Creating Measures with Power BI DAX Formulas
Measures are dynamic calculations based on the filter context of the visuals.
Steps to Create a Measure:
- Open Power BI Desktop
- Locate the “Modeling” tab
- Click “New Measure”
- Write the formula and be sure to name it clearly
Example:
Average Sales = AVERAGE(Sales[SalesAmount])
Use these in cards, charts, and tables for real-time updates.
Using DAX Studio Power BI
DAX Studio is an external tool designed for writing, analyzing, and debugging DAX queries. It’s a must-have for anyone working with complex DAX models.
Key Features:
- Query Plan Analysis
- Performance Metrics
- Exporting Data
- Server Timings for Optimization
DAX Studio Power BI is especially helpful when optimizing large datasets and ensuring the best performance.
Real-World Use Cases of DAX Function Power BI
- Year-over-Year Sales
YoY Sales = CALCULATE(SUM(Sales[SalesAmount]), SAMEPERIODLASTYEAR(‘Date'[Date]))
- Cumulative Sales
Running Sales = CALCULATE(SUM(Sales[SalesAmount]), FILTER(ALL(‘Date’), ‘Date'[Date] <= MAX(‘Date'[Date])))
- Top N Products by Sales
Top Products = TOPN(5, SUMMARIZE(Products, Products[ProductName], “TotalSales”, SUM(Sales[SalesAmount])), [TotalSales], DESC)
- Customer Segmentation
Customer Group = IF([Total Sales] > 100000, “Premium”, “Regular”)
These examples show how flexible and powerful DAX formulas Power BI can be in real scenarios.
Power BI DAX for Time Intelligence
DAX makes it easy to track KPIs across time periods. For example: Month-to-Date Sales:
Sales MTD = TOTALMTD(SUM(Sales[SalesAmount]), ‘Date'[Date])
Quarter-to-Date Sales:
Sales QTD = TOTALQTD(SUM(Sales[SalesAmount]), ‘Date'[Date])
Time intelligence is a key strength of the Power BI DAX function library.
Best Practices for Using DAX in Power BI
- Naming Descriptively: Instead of “Measure 1”, which doesn’t give much detail, name your measures descriptively.
- Use Variables: Variables can increase the readability of your DAX formula, but they will also help increase the performance of your overall formula and calculation.
- Avoid compound Calculated Columns: Use measures, if you can!
- Use DAX Studio Power BI for performance optimization: DAX Studio is your best friend for debugging!
- Do not write large formulas: Simply breaking down your formulas into smaller ones will help. You probably aren’t going to write a ten-line DAX measure all in one line.
Example using VAR:
- Profit Margin =
- VAR TotalSales =
- SUM(Sales[SalesAmount])
- VAR TotalCost = SUM(Sales[Cost])
- RETURN DIVIDE(TotalSales – TotalCost, TotalSales)
Your Content Goes Here
Comparing Calculated Columns vs Measures
| Features | Calculated Column | Measure |
|---|---|---|
| Storage | Stored in model | Calculated on the fly |
| Context | Row Context | Filter Context |
| Performance | May slow large models | More Efficient |
Always choose measures unless a calculated column is essential.
Conclusion
DAX is not just a formula language; it can also be a window into the possibility of gaining substantial insight from the data. And with the knowledge of DAX functions in Power BI, you’ll be able to build strong reports, improve decision-making, and enhance your analytical capabilities.
Regardless of whether you’re analyzing time series trends, designing financial dashboards, or segmenting customers, your pathway will always feature the use of Power BI DAX formulas. Tools like DAX studio Power BI will provide you with the capabilities to ensure those formulas are fast, scalable, and reliable.
So, practice, play and debug because every Power BI expert started out as a novice in this incredible world of DAX function Power BI.


